


 Deutsch
 English
 Español
 Français
 Nederlands
 Português


 Share
Share




Introduction: The Largest Energy Disruption Since the 1970s
The late-February 2026 closure of the Strait of Hormuz following the outbreak of military conflict between the United States, Israel, and Iran has removed nearly 20% of global oil supplies from the market, making it the largest disruption to world energy supply since the 1970s oil crises. By early March, tanker traffic through the 34-kilometer-wide chokepoint had collapsed by over 90%, with the Iranian Revolutionary Guard Corps (IRGC) effectively shutting the strait to vessels linked to U.S. and allied nations. The crisis is actively unfolding, with fresh economic impact data released weekly by the IMF, Dallas Federal Reserve, and UNCTAD — cementing this as the single most consequential global energy and economic story of early 2026.
According to the Dallas Federal Reserve, the disruption removes approximately 20 million barrels per day from global markets — three to five times larger than past geopolitical oil shocks such as the 1973 Yom Kippur War or the 1990 Gulf War, which removed only about 6% of supplies. The crisis is accelerating a structural reordering of global energy trade routes, forcing Asian import-dependent economies to scramble for alternatives, reshaping investment in renewables and nuclear capacity, and testing whether the post-2022 rules-based energy architecture can survive a shock of this magnitude.
Context: How the Strait of Hormuz Closure Unfolded
The crisis began on February 28, 2026, when the United States and Israel launched coordinated airstrikes under the code name 'Operation Epic Fury,' targeting Iranian military infrastructure and leadership. The opening salvo consisted of nearly 900 joint attacks within 12 hours, killing Supreme Leader Ali Khamenei and dozens of top officials. Iran retaliated with hundreds of missiles and thousands of drones targeting U.S. embassies, military installations, and oil infrastructure across the Middle East, including vessels in the Strait of Hormuz. By March 2, at least three commercial vessels had been damaged, insurers withdrew or repriced coverage, and major carriers like Maersk began rerouting via the Cape of Good Hope.
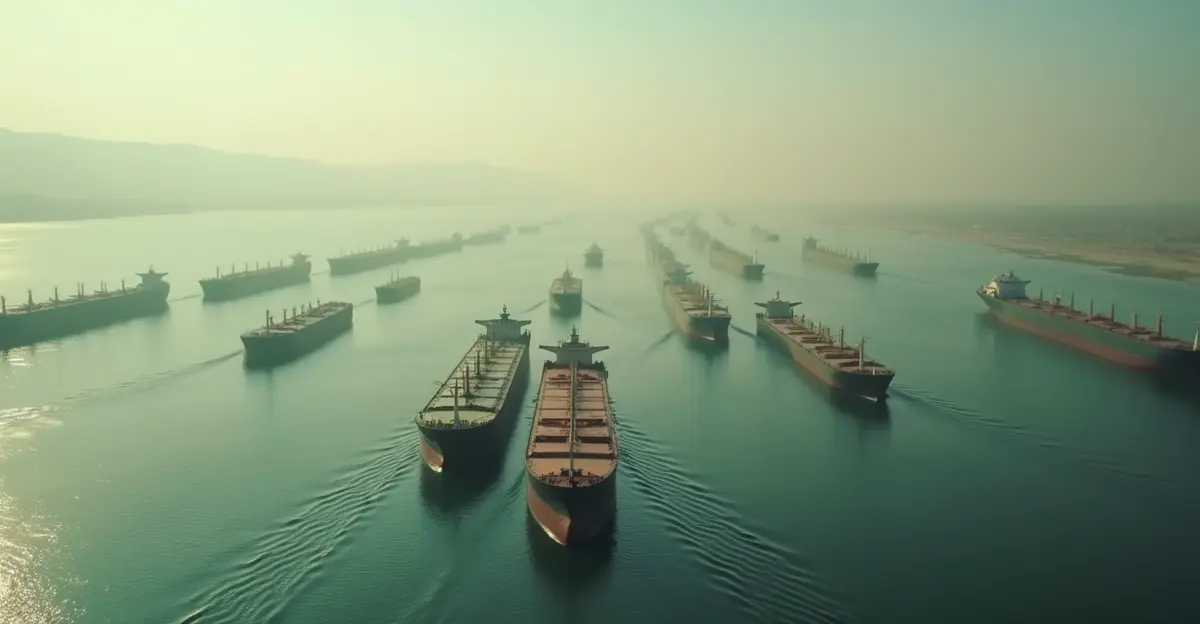
The IRGC issued warnings forbidding passage, boarded merchant ships, and laid sea mines. By late March, traffic through the strait had dropped to near zero, with over 150 tankers anchored outside the waterway. The UNCTAD reported that approximately 20,000 mariners and 2,000 ships were stranded in the Persian Gulf. A temporary ceasefire was agreed on April 8, but Iran began charging tolls of over $1 million per ship, and the U.S. Navy simultaneously blockaded Iranian ports, creating what The Guardian described as a 'dual blockade.' The situation remains highly volatile as of mid-2026.
The 2026 Iran war has exposed the fragility of global energy infrastructure and the strategic leverage held by nations controlling critical maritime chokepoints.
Economic Impact: Dallas Fed and IMF Scenarios
Oil Price Surge and GDP Contraction
The Dallas Federal Reserve's modeling provides a stark quantification of the crisis. Under a one-quarter closure scenario (through June 2026), West Texas Intermediate (WTI) oil prices are estimated to rise to $98 per barrel, while annualized global real GDP growth is cut by 2.9 percentage points in Q2 2026. If the closure extends to two quarters, oil could reach $115 per barrel with negative growth persisting through Q3. A prolonged three-quarter closure would see oil at $132 per barrel, with the global economy remaining in contraction through year-end. Even after reopening, real GDP is expected to remain below pre-closure levels for an extended period.
The IMF published three scenarios in its April 2026 World Economic Outlook. The baseline (assuming a short-lived conflict) puts global growth at 3.1% with headline inflation at 4.4%. The adverse scenario ($100/barrel oil) sees growth drop to 2.5% with 5.4% inflation. The severe scenario ($110–$125/barrel) pushes growth to just 2.0% — near-recession — with inflation exceeding 6%. IMF Chief Economist Pierre-Olivier Gourinchas warned that the world is 'drifting closer to the adverse scenario daily.'
Broader Commodity and Supply Chain Fallout
The crisis extends far beyond oil. Roughly 85% of Middle East polyethylene exports transit the strait, impacting packaging and consumer goods. Aluminum prices have surged, threatening automotive, aerospace, and construction manufacturing. Fertilizer prices jumped from $475 to $680 per metric ton, endangering Midwest corn and soy planting. The U.S. Energy Information Administration reported that an estimated 7.5 million barrels per day of crude oil production was shut in during March, rising to 9.1 million b/d in April. U.S. retail gasoline prices are forecast to average above $3.70/gallon in 2026, with a monthly April peak near $4.30/gallon. Diesel prices are expected to peak above $5.80/gallon in April.
The global energy supply chain is under unprecedented strain, with inventory cover measured in weeks rather than months.
Reshaping Global Energy Trade Routes
One of the most profound consequences of the Hormuz closure is the forced reordering of global energy trade routes. Middle Eastern oil and gas producers are scrambling to expand alternative export pathways. Saudi Arabia's East-West pipeline and the UAE's Habshan–Fujairah pipeline have combined capacity of 3.5–5.5 million barrels per day — far below the 20 mb/d that previously transited the strait. Moreover, these alternatives proved vulnerable: Saudi's pipeline and Fujairah port were attacked by Iran during the conflict.
Asian import-dependent economies — China, India, Japan, and South Korea — which receive roughly 80% of Hormuz-transited oil, are facing the most acute pressure. According to Wood Mackenzie, over 11 million barrels per day of Gulf crude and condensate is currently curtailed, and more than 80 million tonnes per annum of LNG supply (20% of global supply) remains inaccessible. The crisis is accelerating investment in alternative supply routes, including expanded pipeline networks from Central Asia and Russia, as well as increased reliance on the Cape of Good Hope route — though the latter adds significant cost and transit time.
The energy trade route diversification is reshaping geopolitical alliances, with Asian nations deepening energy ties with Russia, the United States, and African producers.
Investment Shift: Renewables and Nuclear Acceleration
Historical parallels to the 1970s oil shocks suggest that major energy disruptions catalyze structural shifts in energy investment. The current crisis is no exception. Solar photovoltaic costs have declined 99.6% since 1976, making renewables increasingly competitive even without subsidies. The SAIS Observer notes that prolonged Strait closure could accelerate renewable adoption as rising fossil fuel prices incentivize substitution and demand destruction, particularly in developing nations hit hardest by the crisis.
Nuclear energy is also experiencing a renaissance. The World Economic Forum reports that surging AI demand and geopolitical shocks are renewing global interest in nuclear power. Roughly 60 reactors are under construction worldwide. Poland is advancing its first nuclear plant, Germany is reconsidering its opposition, China continues rapid builds, and the U.S. aims for 5 GW in upgrades and 10 new large reactors by 2030. Small Modular Reactors (SMRs) are being explored for co-location with data centers, though many designs remain immature.
The renewable energy investment surge is being driven by both market forces and policy responses to the crisis.
Testing the Post-2022 Rules-Based Energy Architecture
The crisis is testing whether the international energy governance framework established after Russia's 2022 invasion of Ukraine can withstand a shock three to five times larger. The post-2022 architecture relied on coordinated strategic petroleum reserve releases, price caps, and diversification away from Russian supplies. However, the Hormuz disruption dwarfs the 2022 crisis in scale. IEA Executive Director Fatih Birol warned that the global economy can be 'taken hostage' by a narrow chokepoint, urging diversification.
Europe, which diversified from Russian gas after 2022, now faces acute vulnerability as Qatar — supplying 12–14% of European LNG — halted production after Iranian drone attacks. With gas storage at just 30% capacity after a harsh winter, the crisis threatens industrial competitiveness across chemicals, fertilizers, steel, and aluminum sectors. Oxford Economics projects that sustained $140 oil would push the Eurozone into contraction, exposing that Europe's post-2022 diversification merely replaced one dependency with another on volatile global LNG spot markets.
The post-2022 energy security framework is proving inadequate for a crisis of this magnitude, prompting calls for a new multilateral approach to chokepoint security.
Expert Perspectives
'This is the single largest oil supply disruption in the history of the world oil market,' said a Dallas Fed economist. 'Even the mere expectation of disruption can trigger oil price surges and economic contraction.'
'The global economy is drifting closer to the adverse scenario daily,' warned IMF Chief Economist Pierre-Olivier Gourinchas. 'Central banks must maintain anchored inflation expectations while providing narrowly targeted fiscal support.'
'Iran's gambit may backfire long-term as exporters seek permanent alternative supply routes, weakening Tehran's strategic leverage,' noted a CNBC analysis of pipeline alternatives.
FAQ
What caused the Strait of Hormuz closure in 2026?
The closure resulted from the U.S.-Israel military campaign against Iran (Operation Epic Fury) launched on February 28, 2026, and Iran's retaliatory blockade of the strait, including attacks on vessels, mining of the waterway, and IRGC warnings forbidding passage.
How much global oil supply has been disrupted?
Approximately 20 million barrels per day — nearly 20% of global oil supplies — have been removed from the market, making it the largest disruption since the 1970s.
What are the projected oil prices under different scenarios?
The Dallas Fed models WTI at $98/barrel for a one-quarter closure, $115 for two quarters, and $132 for three quarters. Wood Mackenzie's worst-case scenario sees Brent approaching $200/barrel if the strait remains closed through 2026.
Which economies are most vulnerable?
Asian import-dependent economies (China, India, Japan, South Korea) are most exposed, along with European nations reliant on Qatari LNG. Vulnerable developing economies include Lebanon, Jordan, Egypt, and several sub-Saharan African nations.
How is the crisis reshaping energy investment?
The crisis is accelerating investment in renewables (especially solar PV), nuclear power (including SMRs), and alternative energy trade routes such as expanded pipelines and the Cape of Good Hope route.
Conclusion and Future Outlook
The Strait of Hormuz crisis of 2026 represents a watershed moment for global energy security. The immediate economic impacts — oil above $100/barrel, GDP growth cut by nearly 3 percentage points, and inflation surging above 6% in severe scenarios — are already being felt worldwide. However, the longer-term structural consequences may prove even more significant. The crisis is accelerating a pivot away from fossil fuel dependency, reshaping global trade alliances, and exposing the fragility of the post-2022 energy architecture. Whether the world emerges with a more resilient, diversified energy system or descends into prolonged economic stagnation depends on the duration of the closure and the policy responses enacted in the coming months.

Follow Discussion