Public Transit Recovery Accelerates with Strategic Service Adjustments
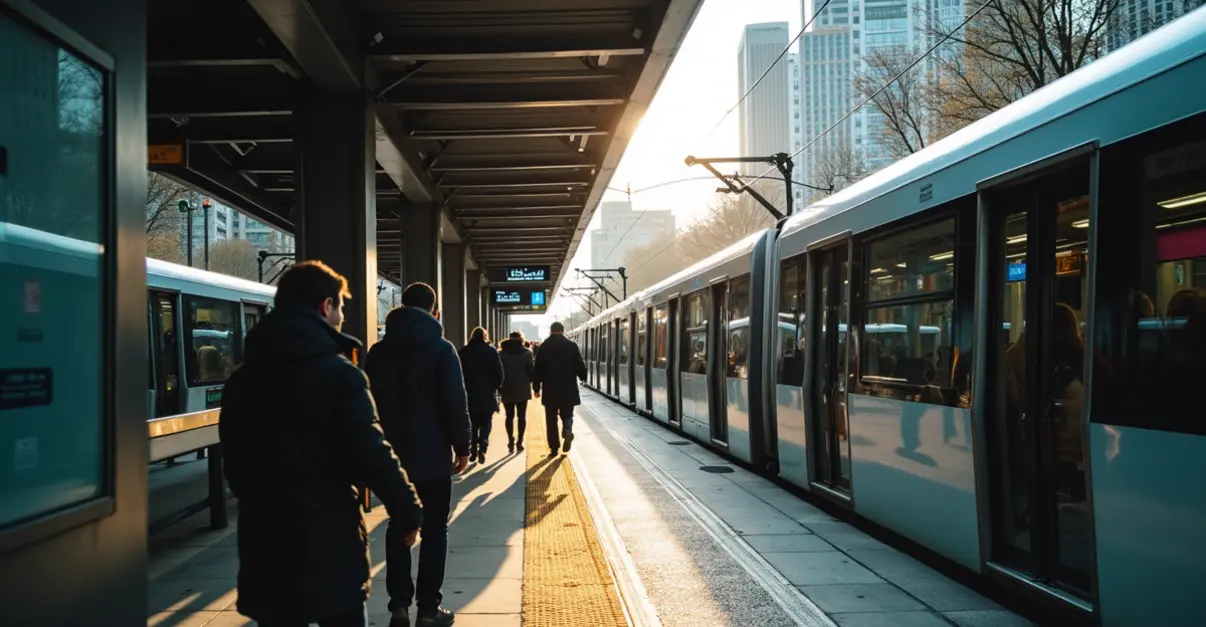
Urban transit systems across the United States are experiencing a significant ridership rebound, reaching 85% of pre-pandemic levels according to recent reports from the American Public Transportation Association (APTA). This recovery, driven by strategic service adjustments and new timetables, marks a turning point for agencies that have faced severe financial challenges since 2020. 'We're seeing passengers return to transit in numbers we haven't witnessed since before the pandemic,' says transit analyst Michael Chen. 'The key has been smarter scheduling that matches actual demand patterns rather than pre-2020 assumptions.'
Capacity Planning Drives Revenue Recovery
The financial picture for transit agencies is improving alongside ridership gains. With federal COVID-19 relief funds expiring, agencies have implemented sophisticated capacity planning strategies to optimize revenue recovery. The National Transit Database (NTD) shows that agencies are now operating with greater efficiency, delivering 7.7 billion passenger trips in 2024—an increase of 491 million from the previous year. 'The fiscal cliff was real, but agencies have responded with data-driven service adjustments,' explains transportation economist Dr. Sarah Williams. 'By aligning service frequency with actual demand, they're maximizing revenue while controlling costs.'
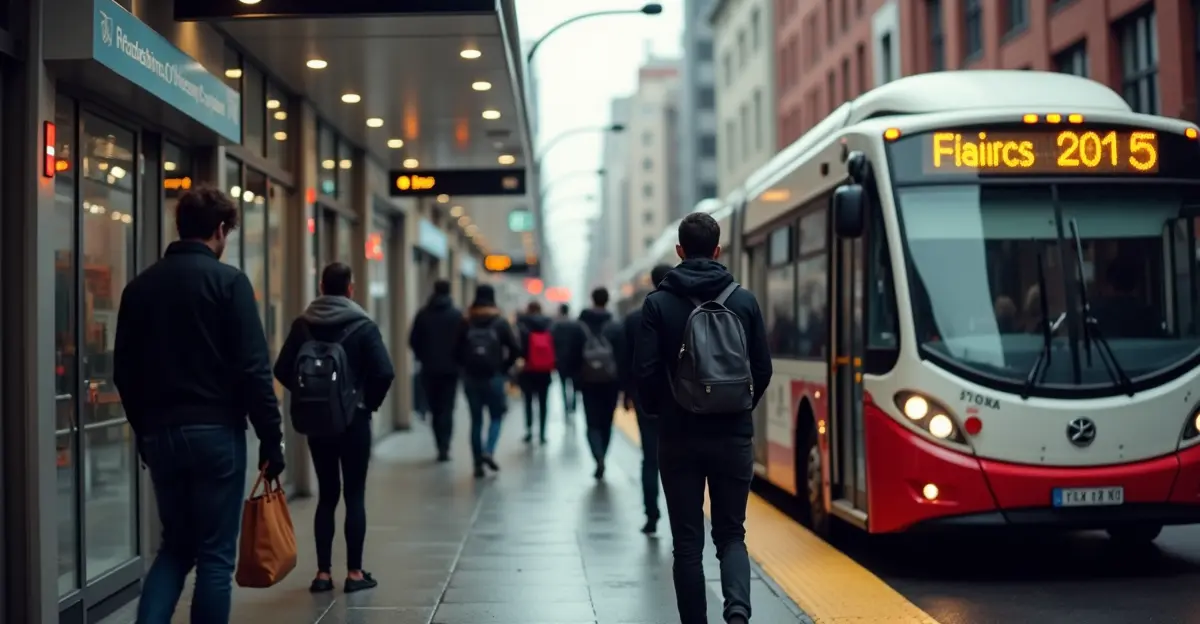
Bus systems lead the recovery at 86% of 2019 levels, with demand response services reaching an impressive 93% recovery. Smaller cities with populations under 100,000 have rebounded to 88% of pre-pandemic ridership, outperforming larger metropolitan areas. This recovery pattern suggests that transit agencies that quickly adapted their timetables and service structures have fared best in the post-pandemic landscape.
Service Adjustments and New Timetables
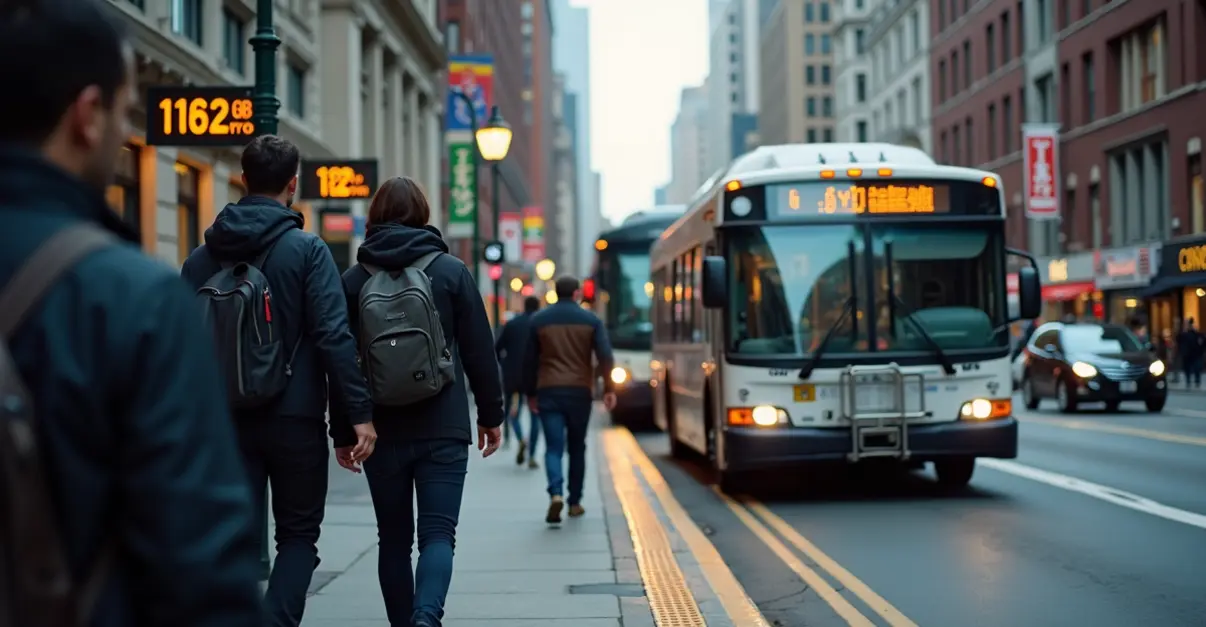
Transit agencies nationwide have overhauled their scheduling approaches, moving from traditional fixed schedules to more flexible, demand-responsive timetables. These adjustments include increased frequency during peak commuting hours, modified weekend service patterns, and better integration between different transit modes. The National Transit Database has been instrumental in providing the data needed for these strategic decisions, with recent updates focusing on enhanced geospatial data and improved reporting requirements for 2025-2026.
In New York, the MTA has implemented revised financial planning that incorporates these service adjustments, as detailed in their 2025-2028 Financial Plan. Similarly, WMATA in Washington DC has proposed budget revisions for FY2025 and forecasts for FY2026 that reflect these new operational realities. 'The old timetables were based on 2019 travel patterns that simply don't exist anymore,' notes transit planner Elena Rodriguez. 'We've had to completely rethink how we schedule service to match new hybrid work patterns and changing commute behaviors.'
Economic Impact and Future Challenges
The ridership recovery has significant economic implications. According to APTA research, public transportation generates $5 in economic output for every $1 invested, and transit riders save over $13,000 annually compared to driving. However, challenges remain as agencies navigate the post-pandemic funding landscape. The 'fiscal cliff' created by expiring federal relief funds continues to threaten service stability, with some agencies facing potential service cuts if sustainable funding solutions aren't found.
Innovative approaches are emerging, including Pennsylvania's redirection of highway funds to transit and New York's congestion pricing proposal. The political landscape remains complex, with suburban areas often opposing transit funding despite potential benefits like reduced congestion. 'The recovery we're seeing is fragile,' warns transportation policy expert James Thompson. 'Without stable, long-term funding and continued service optimization, we risk falling back into a transit doom loop where service cuts lead to ridership losses and further revenue declines.'
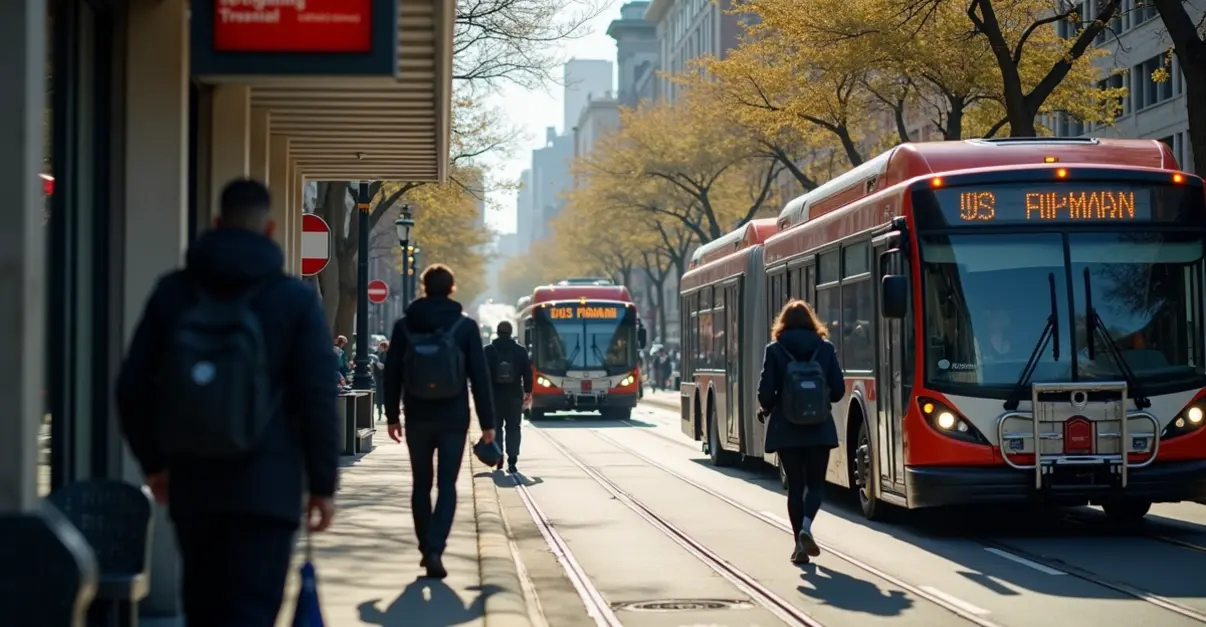
Looking ahead, transit agencies are focusing on infrastructure improvements, with 1,600 zero-emission buses now in service nationwide and bus accessibility for people with disabilities reaching 99.8%. The continued refinement of timetables and capacity planning will be crucial for maintaining the current recovery trajectory and building more resilient, sustainable transit systems for the future.


Follow Discussion